


No company wants to struggle with a high employee turnover rate and lose hard-working talent to their competitor. Sometimes, the HR team works hard, but employees don’t stay for long. Managers assume it’s because of better salary offers, but exit interviews might reveal deeper issues like a lack of growth. Without proper metrics and performance data, future decisions rely on assumptions, leading to ineffective strategies and wasted resources.
In fact, according to a study conducted by McKinsey, companies prioritizing performance metrics see a 4.2x higher success rate and 30% revenue growth.
Today’s HR tech makes tracking and boosting performance easier than ever. The right performance measurements help HR teams boost productivity, engagement and company growth.
Let’s explore how HR teams can use metrics to drive real impact.
What are performance metrics?
Performance metrics are quantifiable data used to track, assess and evaluate the effectiveness of various business processes.
In human resource management, these metrics help you understand how well employees, teams or departments perform against established standards and objectives. HR performance metrics include data such as turnover rates, training effectiveness, labor costs, expenses per employee, and more.
Importance of performance metrics in HR
Assessing performance metrics is an essential HR skill that aids organizations in management and monitoring development. Here’s why tracking these metrics is important.
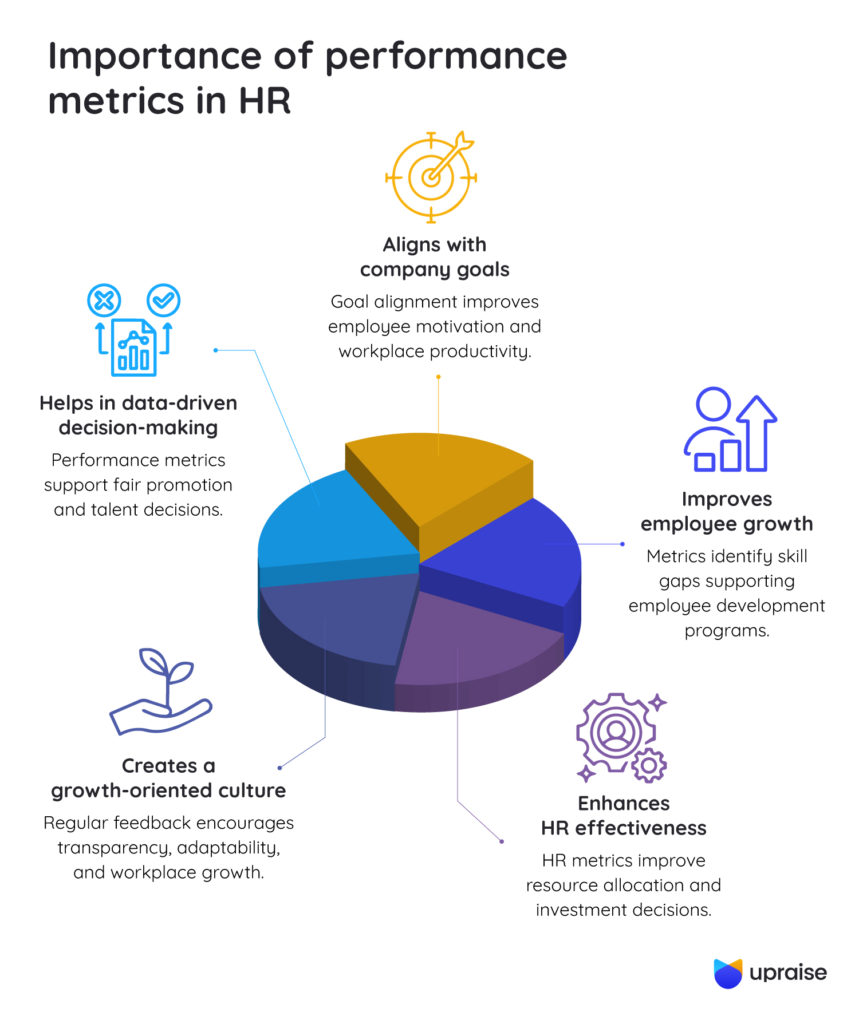
Helps in data-driven decision-making
Performance metrics help HR teams make choices that are grounded in solid data. These metrics ensure fairness in promotions, raises and talent management.
Aligns with company goals
When employees understand how their efforts contribute to the company’s achievements, they stay motivated and focused. This helps in tracking individual contributions and progress against essential goals.
Improves employee growth
Metrics help in identifying skill gaps and training requirements, allowing HR teams to build targeted development programs. This clear path for growth keeps employees engaged, motivated and eventually retained.
Enhances HR effectiveness
Monitoring HR initiatives shows what works and what doesn’t. This helps HR teams in distributing resources effectively and justifying investments in employee programs with data-backed analysis.
Creates a growth-oriented culture
Refining performance management processes regularly promotes transparency and regular feedback. This nurtures an environment that supports growth, adaptability, and sustainable success.
HR metrics extend far beyond numbers. They offer valuable insights that assist organizations in making important decisions that improve performance and create a growth-driven environment.
Types of performance metrics
HR performance metrics can be categorized according to their role in evaluating employees, improving HR efficiency, and driving business outcomes. Here are some of the most impactful HR performance metrics and their significance.
- Financial Metrics: This metric translates HR activities into monetary terms, helping teams understand the business impact of people management. It helps optimize budgets, improve cost efficiency and justify investments in workforce programs.
- Operational Metrics: It helps in measuring the effectiveness of day-to-day HR processes like time to hire, absenteeism rates, training completion rates and employee productivity. This improves process efficiency, enhances workforce engagement and reduces turnover.
- Project Management Metrics: This metric helps in managing several internal projects, such as implementing new HR systems or rolling out new benefits programs. This allows the projects to run smoothly, meet objectives and deliver measurable improvements.
- Customer Satisfaction Metrics: As the internal service provider for employees, HR plays a crucial role in creating a positive work environment and improving overall engagement. This metric helps in measuring employee satisfaction through surveys and feedback mechanisms.
[Infographic suggestion: A hierarchical flowchart with ‘Performance Metrics’ at the top that branches out into four categories (Financial, Operational, Project Management, and Employee Satisfaction) Each category presents a description with examples as follows.
Financial Metrics:
- Revenue per employee
- Cost per hire
- ROI of training programs
Operational Metrics
- Time to hire
- Absenteeism rates
- Training completion rates
- Employee productivity
Project Management Metrics
- HR system implementation
- Adoption rate of new policies
- Completion timelines for HR initiatives
Employee Satisfaction Metrics
- Employee satisfaction survey results
- Feedback scores
- Retention and engagement trends
Infographic: The types of performance metrics can be designed into a flowchart or bubble chart.]
Combining all these metrics gives you an overview of performance and impacts the organization’s overall success.
Key performance metrics examples by industry
While the core principles of HR metrics remain consistent, the specific metrics that hold the most significance can vary across different industries. Here are 7 key performance metrics that can be used to quantify HR practices, complete with formulas where applicable:
Infographic suggestion: A two-column table with ‘Metrics’ in the left column and ‘Formula’ in the right.
| Metrics | Formula |
| Cost of hiring | Cost per hire = (total recruitment costs) / (number of hires) |
| Training costs | Training cost per employee = (total training expenses) / (total number of employees) |
| Employee revenue generated | Revenue per employee = (total revenue) / (total number of employees) |
| Return on investment (ROI) | HR Return on Investment (ROI) = [(Financial Gains from HR Initiatives – Cost of HR Initiatives) / Cost of HR Initiatives] x 100 |
| Employee turnover rate | Employee turnover rate = (number of employee exits in one year/average number of employees during that period) x 100 |
| Cost of employee turnover | Turnover costs = separation cost + vacancy cost + replacement cost + external hiring costs + cost of training |
| Cost of benefits | Benefits Cost Per Employee = (total benefits expenses) / (number of employees) |
Now let’s look into some examples of performance metrics:
Cost of hiring
This metric calculates the total expense incurred to hire a new employee, including recruitment advertising, agency fees and onboarding costs. However, the costs vary by role and seniority. Calculating cost-per-hire for each level helps you budget more accurately.
Formula: Cost per hire = (total recruitment costs) / (number of hires)
Example: If a company spends $50,000 on recruitment and hires 5 employees of the same role, the cost per hire is $10,000.
Training costs
No matter how talented your new hires are, they need training to adapt to your company’s culture and perform effectively. This includes costs for external trainers, venue expenses and reimbursements for educational programs. By auditing these expenses, you can measure training effectiveness and optimize your budget.
Formula: Training cost per employee = (total training expenses) / (total number of employees)
Example: If a company spends $20,000 on training and 20 employees are trained, the training cost per employee is $1,000.
Employee revenue generated
You need to know how much revenue each employee contributes to evaluate productivity and justify compensation. Comparing this to previous periods helps you spot trends in performance.
Formula: Revenue per employee = (total revenue) / (total number of employees)
Example: If a company generates $1,000,000 in revenue with 50 employees, the revenue per employee is $20,000.
Return on investment (ROI)
It’s crucial to ensure that your HR programs, like recruitment and employee engagement, are delivering financial returns. High ROI shows your initiatives have had a positive impact on the net promoter score, while negative ROI signals the need for strategic changes.
Formula: HR Return on Investment (ROI) = [(Financial Gains from HR Initiatives – Cost of HR Initiatives) / Cost of HR Initiatives] x 100
Example: If a training program costs $10,000 and generates a net benefit of $15,000, the ROI is 50%.
Employee turnover rate
If your turnover rate is high, it could mean dissatisfaction or poor engagement among employees, affecting productivity and morale. Understanding why people leave helps you create effective retention strategies.
Formula: Employee turnover rate = (number of employee exits in one year/average number of employees during that period) x 100
Example: If 20 employees leave a company with 200 employees in a year, the turnover rate is 10%.
Cost of employee turnover
Replacing employees can be expensive, including costs like separation expenses, recruitment and training. Tracking the expenses helps you identify ways to retain employees and reduce costs.
Formula: Turnover costs = separation cost + vacancy cost + replacement cost + external hiring costs + cost of training
Example: A company had 10 employees leave.
Cost for one departing employee = Separation costs ($2,150) + Vacancy costs ($9,400) + Replacement costs ($2,350) + External hiring costs ($0) + Training costs ($2,800) = $16,700.
Total cost for all 10 employees: $16,700 x 10 = $167,000.
Cost of benefits
Staying competitive and hiring the best talent requires innovative ideas and offering benefits that attract and retain employees. This metric ensures you’re providing desirable benefits without exceeding budget limits.
Formula: Benefits Cost Per Employee = (total benefits expenses) / (number of employees)
Example: If a company spends $50,000 on benefits for 100 employees, the cost of benefits per employee is $500.
Infographic: Suggest using a chart like the one in this link.
Using these formulas turns raw HR data into actionable insights, enabling you to measure talent investments and make better decisions to improve workforce performance effectively.
How to choose the right metrics for performance evaluation?
Choosing the right metrics isn’t about tracking everything. The tracked data should align with your company goals, workforce dynamics, and growth strategy. Here’s how to identify which metrics would be the best for your business:
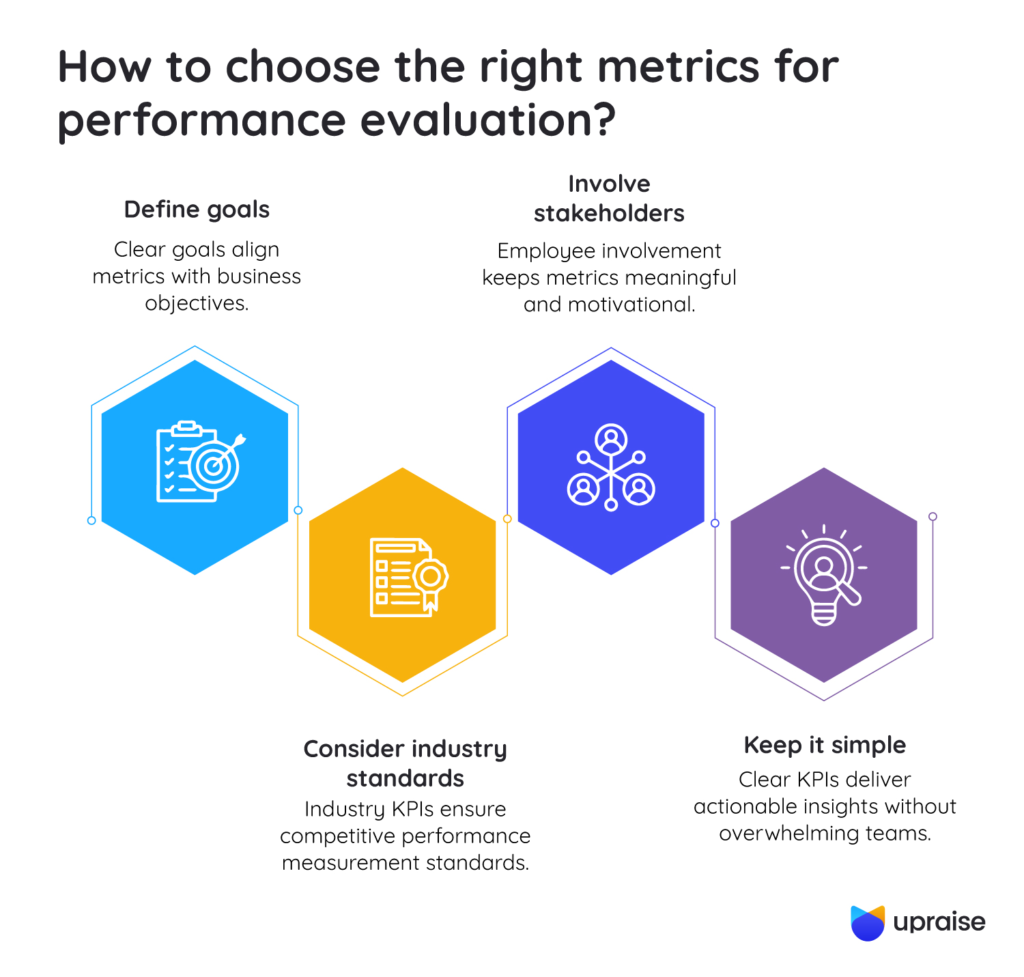
Define goals
Start by clarifying what your organization aims to achieve. Whether it’s productivity, engagement, or efficiency, your metrics should directly align with business objectives.
Consider industry standards
Use industry-specific KPIs to ensure your metrics are relevant and competitive. For example, sales teams track conversion rates, while HR focuses on retention and engagement.
Involve stakeholders
Engage employees and managers in selecting metrics to ensure they are meaningful and motivational.
Keep it simple
Avoid data overload by tracking the most impactful metrics. A few well-chosen KPIs provide clear, actionable insights without overwhelming teams.
Selecting metrics that reflect business priorities helps drive meaningful change, sustain continuous improvement and ensure your efforts are invested in the right place.
Common challenges in performance measurements and how to overcome them
Measuring performance metrics comes with hurdles that can hinder their effectiveness. Here’s how to deal with some common challenges you might face:
Lack of clear goals
It’s difficult to measure performance effectively without knowing your business goals.
Solution: Work with employees to set clear, measurable goals that align with company objectives. When people know their goals, they’re more likely to stay engaged and motivated.
Inconsistent application
If performance standards aren’t applied consistently, it can lead to frustration and resentment.
Solution: Use standardized evaluation templates and train managers to ensure fair and transparent performance reviews.
Resistance to feedback
Feedback can be tough to hear, especially if it feels like criticism rather than guidance.
Solution: Create a culture of open communication and provide constructive feedback that focuses on growth and development.
Data overload
Tracking too many metrics can lead to data overload and make it difficult to focus on what’s important.
Solution: Prioritize key metrics that are most relevant to your business goals and regularly review your metrics to ensure they remain relevant.
Recognizing these challenges allows you to proactively address them, setting the stage for more effective performance tracking and strategic decision-making.
Best practices for tracking and measuring performance
Once you have overcome your challenges, it’s important to utilize performance metrics that fit your organization. You can effectively track and measure performance with these best practices:
Use performance management software
An Agile performance management software like Upraise for Employee Success helps you turn performance data into actionable improvements by integrating Objectives and Key Results (OKRs) within Jira.

Courtesy- Amoeboids Upraise App for Employee Success
Its reports feature gives you a clear view of team progress so you can identify areas for coaching and ensure every employee’s efforts align with your business goals.
Focus on performance
Evaluations should be objective and skill-based, not personal. Instead of saying, “You’re not a team player,” say, “I noticed you prefer to work alone. Let’s explore ways to collaborate more effectively.”
Set SMART goals
Vague goals like “do better” or “work harder” don’t drive results. SMART goals (Specific, Measurable, Achievable, Relevant and Time-bound) provide clarity and direction.
For example, instead of saying, “Increase sales,” suggest, “Increase monthly sales by 15% over the next three months by reaching out to 20 new prospects per week.”
Track progress
Performance measurement should be an ongoing process. Use dashboards, reports and check-ins to monitor progress against goals and keep employees motivated throughout.
This helps you create a transparent and growth-focused performance management system.
These best practices improve HR effectiveness, strengthen the connection between employee performance and overall business success, and help your organization maximize its human capital potential.
Conclusion
Metrics and performance data change how business manage their workplace, shifting HR from an administrative function to a strategic hand. Measuring the right metrics, like hiring efficiency, employee engagement and productivity, helps you gain valuable insights about your business processes that might otherwise go unnoticed.
This helps you create a positive work environment where every effort counts. These measurements are opportunities to learn how HR can help employees reach their full potential. When HR leaders commit to data-driven decision-making, both employees and companies win.
FAQs
Q1. How do you calculate performance metrics?
The method of calculating performance metrics depends on the metric being analyzed. Once you know what metrics you want to track, simply apply the formulas to get the data you need. This helps you measure key aspects like productivity, efficiency and profitability.
Q2. How do you create performance metrics?
Performance metrics can be created by setting clear, measurable goals that align with business objectives. This involves identifying key performance indicators (KPIs), setting benchmarks, and establishing a system for tracking and analyzing data over time.
Q3. How do you define performance metrics?
Performance metrics are measurable data used to evaluate the effectiveness and efficiency of an employee, team, or business process. They provide data-driven insights into areas like employee engagement, hiring effectiveness, and operational performance.
Q4. How do you perform metric conversions?
Perform metric conversions by using a common scale or unit to compare different measurements easily. Use standard conversion formulas or tools to translate different units of measurement accurately and ensure consistency across datasets for accurate analysis.
Courtesy- Amoeboids Upraise App for Employee Success


Pingback: HR KPIs to Measure Employee Success – Sean Brady