

When it comes to tracking progress, you can’t just rely on guesswork – you need measurable data that tells you whether you’re moving in the right direction. That’s where key performance indicators (KPIs) come in.
A set of KPIs helps you quantify how well your team is performing when measured against your defined goals. Whether you’re in marketing, sales, finance or product development, choosing the right KPIs can help you track and measure your progress towards achieving your set objectives.
Not all KPIs are created equal. Some provide valuable insights that drive smart decision-making, while others just add to the noise. In this guide, we’ll break down what a KPI is, why it’s important and how to choose and implement the right ones across different business functions.
What is a KPI?
If you’ve ever set revenue targets for a quarter or even tracked your steps on a fitness app, you’ve already used KPIs in some form. A KPI is a measurable way to track progress over time. It helps you see if you’re hitting your goals, exceeding expectations, and helps identify areas that need improvement.
KPIs come in different forms, such as leading and lagging indicators, which predict future trends and past performance. While businesses use KPIs to measure financial growth, operational efficiency, and customer satisfaction, these metrics can also be valuable for tracking personal goals and productivity.
The key takeaway? A well-defined KPI should be SMART i.e. Specific, Measurable, Achievable, Relevant and Time-bound. It should also ideally be directly tied to an important business goal – not just a vanity metric that looks good on a dashboard.
Why are key performance indicators important?
A business without KPIs is like a car without a speedometer – you might be moving, but you have no idea how fast or in which direction. They help you evaluate your project’s health and track its progress in real-time. Here are a few reasons every business needs the right set of KPIs:
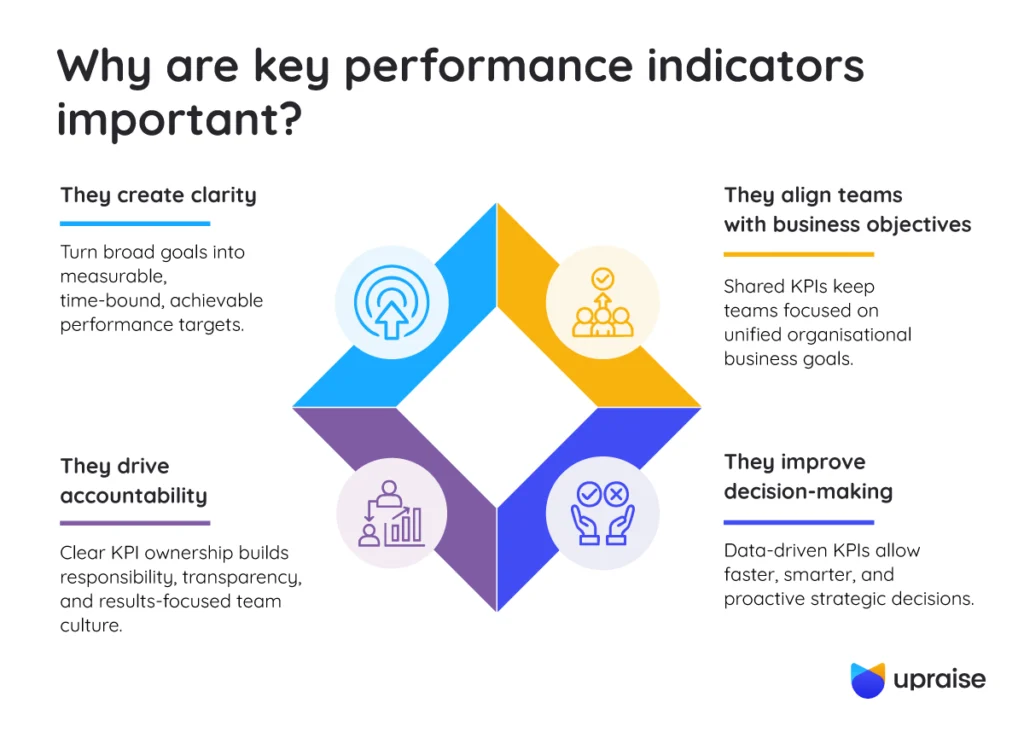
- They create clarity: KPIs turn broad goals into concrete numbers. Instead of saying, “We need to improve customer retention,” you can set a KPI like “Increase customer retention rate by 15% in six months.”
- They align teams with business objectives: When every department tracks relevant key performance indicators, everyone stays focused on shared business objectives, creating alignment across the organization.
- They improve decision-making: Data-backed KPIs help you adjust strategies quickly. For example, if you see a drop in customer satisfaction scores, you can immediately focus on fixing the issue instead of waiting for larger problems to arise.
- They drive accountability: Teams function in harmony when each of your team members knows exactly what they’re responsible for. Assigning ownership of specific KPIs to specific team members will ensure that they take responsibility for their performance, which in turn drives a result-oriented culture.
Without KPIs, your team can end up wasting time and resources on tasks that don’t drive any real growth. With the right type of KPIs, you can keep track of your team’s progress, help them stay productive and make better business decisions.
Types of KPIs
There isn’t a one-size-fits-all approach to KPIs – what works for one team might not work for another. Your KPIs should align with your team’s specific goals and functions. Here’s how you can break them down:
Quantitative KPIs
Quantitative KPIs focus on numbers, like sales, profit margins or the number of new customers. They serve as a numerical proof and record of your organization’s performance over time.
For example, if you’re managing an e-commerce store, tracking monthly sales growth can help you see if your latest marketing strategy is working.
Qualitative KPIs
Qualitative KPIs focus on aspects of performance that can’t be measured with numbers, like customer satisfaction or employee engagement. You can track these through surveys, interviews or feedback forms to get a clearer picture of what’s working and what needs improvement.
For example, if you’re leading a product team, running post-release user satisfaction surveys can help you understand how well a new feature is being received.
Leading KPIs
Leading KPIs help you predict future performance. These indicators show where things are headed rather than just measuring where you’ve been.
For example, if your website traffic is steadily increasing, it could be a sign that your brand awareness is growing, which may lead to higher conversion rates down the line.
Lagging KPIs
Lagging KPIs measure metrics that have already occurred, like quarterly revenue or customer churn rate. They help you evaluate past performance and see which of your strategies worked out and which didn’t.
If you’re tracking annual employee turnover, for instance, it gives you insights into retention trends.
Input KPIs
Input KPIs track the resources you put into a process, like time, money or manpower. Keeping an eye on these helps you understand how efficiently you’re utilizing resources.
If you’re in charge of a development team, monitoring developer hours spent on a new feature can help you understand whether the investment is worth the feature’s impact.
Process KPIs
Process KPIs measure how well your workflows are running. They help you spot inefficiencies so you can fine-tune your processes.
If you’re leading a software team, tracking bug resolution time can tell you how quickly your developers are fixing critical issues, which directly impacts user experience.
Output KPIs
Output KPIs focus on what you’re achieving, like the number of product releases per quarter or customer support tickets resolved. These help you measure whether your efforts are delivering real results.
For example, if you’re managing a product launch, you can track the number of successful deployments per sprint, which can show how efficiently your team is delivering new features.
It’s important to choose the type of KPI that is relevant to your organization and its objectives. The next step is to set them up in a manner that you maximize their utility.
How to set up effective KPIs
Setting KPIs isn’t just about choosing a few impressive-looking metrics. To be effective, KPIs must be specific, measurable, actionable, relevant and time-bound (SMART). This will help you break down a complicated process into simpler steps. It also serves as a foundation to improve your KPIs’ efficiency and choose suitable metrics.
Here’s how to ensure your KPIs drive meaningful impact:
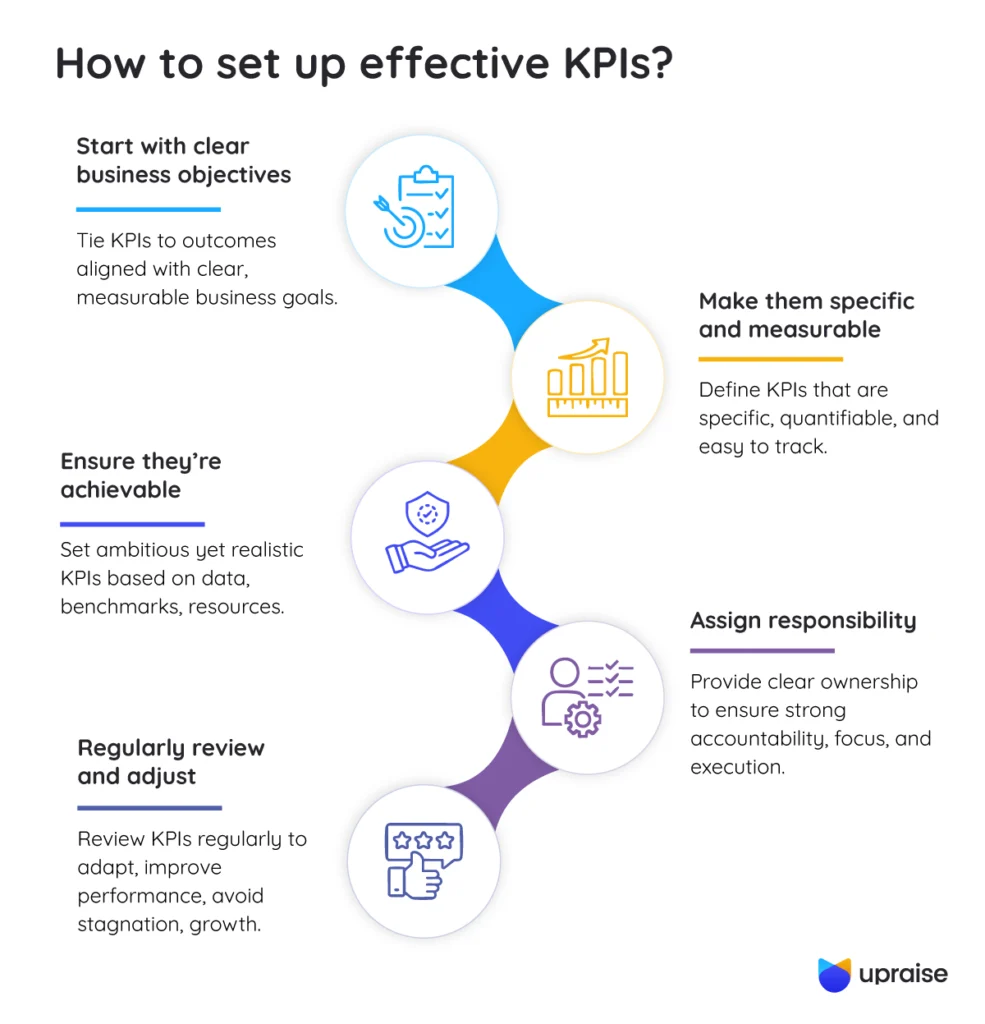
- Start with clear business objectives: Every KPI should tie back to a larger goal and focus on outcome rather than input. For example, if you’re tracking sales performance, a relevant KPI might be monthly revenue growth rather than just the number of cold emails sent to potential customers.
- Make them specific and measurable: Choose KPIs that can be quantified to provide accurate tracking and analysis of your goals. Vague KPIs like “Improve team performance” don’t help anyone. A well-defined KPI would be “Reduce project completion time by 20% over six months.”
- Ensure they’re achievable: Ambition is good, but so is staying grounded. Unrealistic KPIs can demotivate teams by expecting big numbers without the right setup to achieve them. It’s better to set ambitious but attainable targets based on past data, industry benchmarks and the company’s likelihood of providing the right resources and support for achieving these numbers.
- Assign responsibility: A team can only work efficiently when each member knows exactly what they’re responsible for and the cumulative goal that the team is working toward. If five of your team members are all working toward the same KPI, you’re draining resources from other KPIs that are equally important. When you assign clear responsibility to specific team members for each KPI, all the wheels can move in tandem and deliver the results you need.
- Regularly review and adjust: Business needs change over time and so should your KPIs. A recent study suggests that 79% of the companies that participated reviewed their KPIs annually, while 22% of companies reviewed them quarterly. All of these companies were high-performing, which clearly shows it’s crucial to review and adjust your KPIs periodically to avoid stagnation and revenue plateaus.
Want a structured way to set, measure and track KPIs? You can use reliable app like UpRaise for Employee Success that help businesses define and monitor key performance indicators in real time.
Examples of key performance indicators
Now that you know how to set effective KPIs, let’s look at examples of how they are applied across different business functions. Setting up the right KPIs at the proper time will lead to a significant uptick in your organization’s operational efficiency and outcomes.
Some instances where KPIs have proven to be useful include:
Marketing
Marketing teams rely on KPIs to measure campaign success and customer engagement. KPIs like marketing spend and conversion rates serve as clear indicators of success and progress. For example:
- Conversion rate: If only 2% of website visitors turn into customers, it may indicate that landing pages need optimization.
- Customer acquisition cost (CAC): Tracking how much it costs to acquire a new customer helps businesses optimize marketing budgets.
- Brand awareness score: Social media engagement, search volume and direct traffic indicate how well a brand is recognized in the market.
Sales
Sales teams track KPIs to assess performance and close more deals. Tracking leads, opportunities, volume of sales and other metrics can help you achieve your sales targets.
For example:
- Sales cycle length: A longer sales cycle might signal inefficiencies in the pipeline.
- Lead-to-customer conversion rate: If 50% of qualified leads don’t convert, it’s time to revisit the sales approach.
- Monthly recurring revenue (MRR): Essential for subscription-based businesses to track revenue trends.
HR & Employee Performance
HR teams use KPIs to track productivity, retention and overall employee satisfaction. By analyzing the data from various customized KPIs, they can track the organization’s health, productivity and employee satisfaction, among other factors. Here’s how KPIs are useful in HR:
- Employee turnover rate: A high turnover rate may indicate low employee engagement or issues with the workplace culture.
- Time-to-hire: If it takes months to fill open positions, hiring processes need improvement.
- Training effectiveness: KPIs can measure whether employee development programs lead to actual skill improvement.
KPIs have a wide range of applications across multiple sectors such as engineering, customer support, finance, operations, product design and even R&D. Regardless of the function you work in, KPIs have emerged as a necessary component to ensure you succeed. However, there are some issues and downsides to them that you need to consider while applying them to your operations.
Pros and cons of key performance indicators
Tracking key performance indicators (KPIs) is a great way to measure progress and make data-backed decisions, but they’re not without drawbacks. When used correctly, KPIs can keep your team focused and accountable. If they’re poorly chosen, though, they can lead to wasted time and effort. Here’s a look at both sides.
| Pros | Cons |
|---|---|
| Measurable progress: KPIs give you clear, trackable data, so you always know whether you’re moving in the right direction. | Time-consuming: Defining the right KPIs requires a lot of planning, data collection and continuous monitoring – it’s not something you can do overnight. |
| Alignment across teams: With the right KPIs in place, your team and different departments can stay focused on shared business goals instead of working in silos. | Delayed insights: Lagging KPIs only measure what’s already happened, so by the time you see a drop in performance, it may be too late to fix it quickly. Also, the results might be irrelevant or outdated. |
| Smarter decision-making: Instead of guessing what’s working, KPIs help you make informed, strategic choices based on real performance data. | Wrong prioritization: If your KPIs aren’t well thought out, your team might end up focusing on vanity metrics that don’t improve business outcomes. |
| Promotes accountability: When you assign KPIs to specific teams or individuals, it ensures that everyone knows what they’re responsible for and how their work contributes to larger goals. | Overemphasis on numbers: If you only focus on hard data, you might overlook important qualitative factors, like company culture or customer satisfaction. |
| Spot problems early: Leading KPIs act as warning signals, helping you catch and fix problems before they become bigger issues. | Encourages short-term thinking: If you only care about hitting KPI targets, your team may focus on quick wins rather than long-term growth. |
| Motivate your team: Clear, well-defined KPIs give employees a sense of direction and purpose, making it easier for your team to see the impact of their work. | Misusing the system: If employees feel pressured to hit a certain number, they might find workarounds that look good on paper but don’t improve quality. |
By understanding the strengths and limitations of KPIs, you can implement them effectively, ensuring they drive real progress rather than just producing numbers.
Make KPIs Work for You
At the end of the day, KPIs should help you measure and evaluate factors that drive success, not just provide meaningless data. Whether you’re tracking team productivity, customer engagement or revenue growth, the right KPIs help you stay on track, improve decision-making and adjust your strategy when needed.
The key is to ensure your KPIs are relevant, actionable and flexible. A poorly defined KPI can send your team in the wrong direction, while a well-thought-out one can be a game-changer for growth.
Tools like UpRaise for Employee Success can prove immensely helpful in setting, tracking and refining KPIs. With custom KPI dashboards, real-time analytics and seamless integrations, you can make sure your metrics align with business goals and drive results.
Start tracking what truly matters, and book a free demo today.
FAQs
How to measure KPI in a research group?
Measure KPIs by setting clear, measurable objectives that align with research milestones. Use both quantitative data and qualitative insights to track progress and refine strategies.
How to set and measure KPI in Agile?
Define KPIs that support sprint goals and team performance, ensuring they are specific and time-bound. Monitor progress through regular reviews, velocity tracking, and continuous feedback loops.
What is an OKR vs KPI?
OKRs set ambitious, qualitative goals with measurable key results, while KPIs track specific, quantitative performance metrics. OKRs drive strategic vision, whereas KPIs focus on operational success.
What is the difference between KPI and metrics?
KPIs are critical indicators directly tied to strategic objectives, whereas metrics encompass a broader range of performance data. KPIs spotlight key success areas, while metrics provide comprehensive operational insights.
